Insurance Frauds Galore
In this post, I take a quick look at a new database on insurance frauds and discuss potential research questions related to this topic.
Introduction
I recently came across this website of the Coalition Against Insurance Fraud. It provides resources to raise awareness on insurance frauds and compiles legislative updates that may be relevant for the industry professionals as well.
Interestingly, they also provide a Fraud Tracker, which provides details on the reports of frauds. A snippet of the data is shown below:
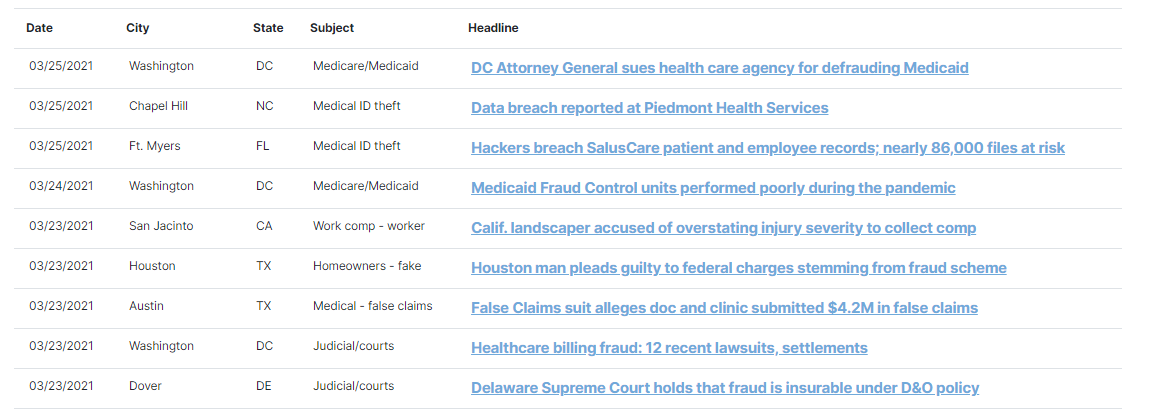
As you can see from the headlines, these cases include both the initial filing of lawsuits by the insurance companies as well as data breaches.
To get a better sense of the insurance frauds, I decided to scrape their entire database. Fortunately, the data is rendered in static pages so I was able to obviate the need to use Selenium. (See this post for the different types of web scraping).
Time-Series Evidence
I first look at the number of frauds over time for different types of insurance. In the figure below, I plot the number of insurance frauds for major insurance types in each year:
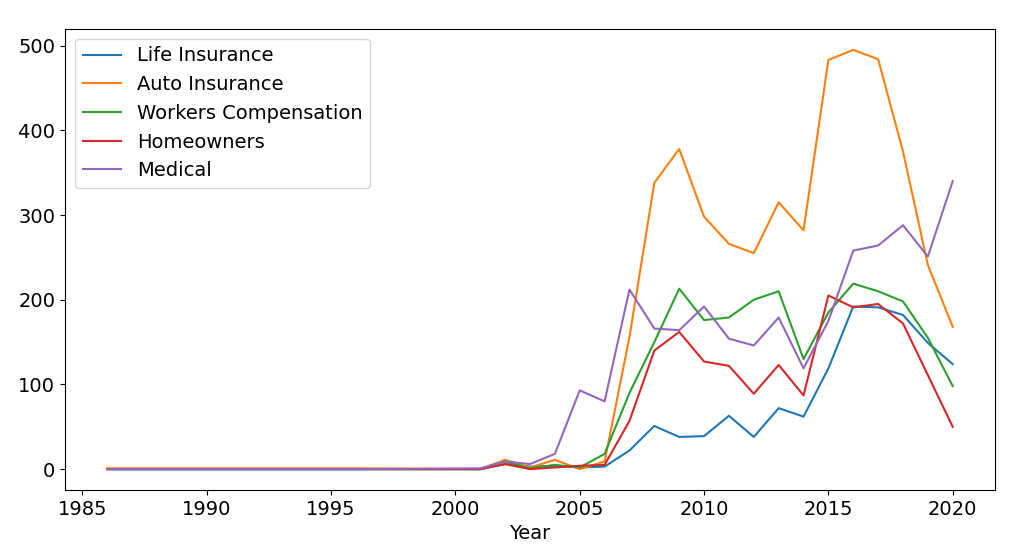
Overall we see a general increasing trend across all lines of businesses. The increase is most pronounced for auto, life, and medical frauds, whereas the number has stayed relatively constant in the past decade for workers compensation and homeowners insurance.
There is a slight dip in 2020, but this is most likely due to the fact that there is a lag between the actual occurrence of the fraud and the action taken by the insurance companies.
Cross-Sectional Evidence
Another interesting cut at the data is across states. For insurance, variation at the state level is quite important since each insurer is regulated and supervised in its state of domicile. For example, a recent working paper by Ishita Sen and Varun Sharma shows that the regulators’ resources and supervision vary significantly across US states.
In the table below, I report the number of insurance frauds in each state from 2011 to 2020. I exclude the earlier years due to suspect data availability. I report the top ten states with the largest total number of frauds across the five insurance lines that I examine.
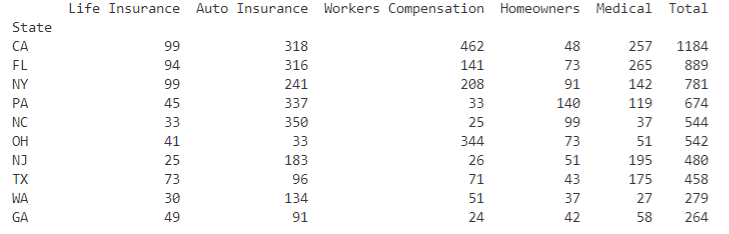
The occurrences of frauds likely correlate with the population in the state (California, Florida, New York). Surprisingly, Texas does not rank so high across all lines in this table, despite the state having the second largest population in the country. The low number of auto insurance frauds is actually quite striking.
Accordingly, there is also substantial heterogeneity in the enactments of state laws designed to counter this trend. For example, mandatory auto insurance photo inspection laws are in effect in only five states: Florida, Massachusetts, New York, New Jersey and Rhode Island (Source: III)
Promising Research Questions
Below I outline a few interesting research questions that could benefit from the use of this data.
- One direction is to try and estimate how pervasive insurance fraud may be. Frauds share a similar characteristic with cyber risk in which only the detected cases are measured. Overcoming this detection problem through structural approaches or relying on natural experiments would be interesting. (e.g. Dyck, Morse, and Zingales (2021)).
- A theoretical model of insurance fraud, perhaps combined with a structural estimation using granular data, would also be interesting. Key modeling ingredients seem to be (1) the expected return to the fraud (how much money can I make if I succeed?) and (2) the risk of getting caught. One would allow both parameters to depend on the type of insurance (life vs auto) as well as states (California vs. Idaho). General economic conditions could affect ingredient (1), while the rollout of new regulation could affect ingredient (2).