Measurement Matters
Much of academic discourse depends on a set of rigorously established “stylized facts.” Providing such facts rely on sound measurement, which is often harder than it seems. I discuss three recent examples that are worth noting.
Wealth Inequality
A paper that challeges the conventional wisdom is not only a delight to read, but it is also one that takes great courage and careful evidence to write. Catherine, Miller, and Sarin (2021)’s “Social Security and Trends in Wealth Inequality” is one such paper.
Their main message is simple: If one takes into account Social Security, top wealth shares have actually not increased in the last three decades. Here are the authors:
When discounted at the risk-free rate, real Social Security wealth increased substantially from $4.9 trillion in 1989 to $52.6 trillion in 2019. When we adjust the discount rate for long-run macroeconomic risk, this increase remains sizable, growing from over $4.0 trillion in 1989 to $41.2 trillion in 2019. Consequently, by 2019, Social Security wealth represents 59% of the wealth of the bottom 90% of the wealth distribution.
While the proposition sounds simple, estimating the Social Security wealth is non-trivial. There are two key decisions to be made: (1) simulating paths of future benefits and payroll taxes and (2) choosing an appropriate discount rate.
- (1) is relatively standard, while (2) requires a bit more reasoning.
- Authors argue that Social Security participants are exposed to long-run macroeconomic risk, and therefore discount rates should reflect this systematic risk.
The result of their exercise is this figure:
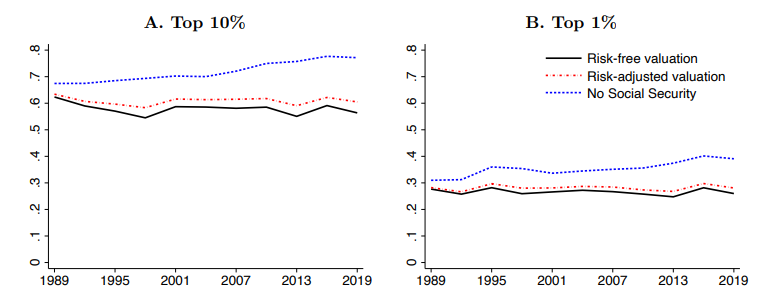
I sympathize with the authors that the Social Security aspect dimension of public wealth is somewhat ignored in these debates. Their analysis begs the question of how the trend changes if we take into account much larger set of policy reforms. Perhaps, this paper by Hendren and Sprung-Keyser (2020) is a good starting point for such extension.
Decline in Labor Share
Here’s another paper called “Human Capitalists” that implies that labor share is somewhat mismeasured when using BEA or BLS data.
The basic message of the paper is that equity-based compensation is important and growing, and taking its measurement seriously seems to suggest that the decline in the labor share is not as extreme as previously thought, and the decline in the high skilled labor share is no longer present.
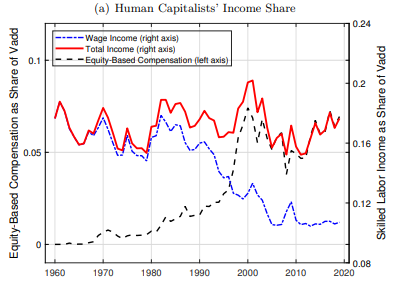
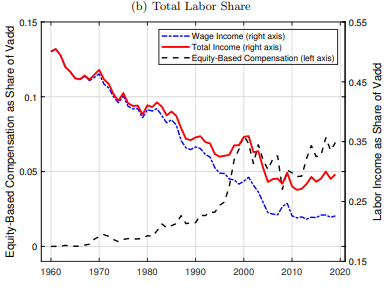
The key measurement challenge is to compute the annual flow of equity-based compensation, which the authors overcome by using the firm-level data on the value of shares reserved for compensation.
As before, there is much left out that are worth exploring. For example, what does equity-based pay look like in private firms? How does equity-based pay contribute to income and wealth inequality, as both seem sensitive to interest rates?
Consumption
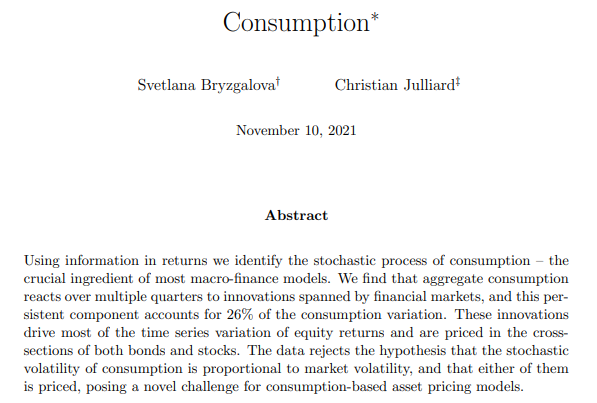
The most basic version of consumption-based CAPM goes as far back as Lucas (1978) and Breeden (1979), yet economists continue to struggle to measure / estimate / specify the process for consumption. The battle continues to this day — consider, for example, this latest paper by Bryzgalova and Julliard (2021):
Efforts to better “measure” consumption have come in two strands.
One line of argument is that standard measure of consumption is a poor empirical proxy, just as the stock market wealth poorly represents the aggregate wealth of the representative investor:
| Paper | Punchline |
|---|---|
| Savov (2011) “Asset pricing with garbage” | CCAPM with garbage as a measure of consumption performs better relative to using NIPA consumption. |
| Kroencke (2017) ”Asset pricing without garbage” | Undoing the filtering in NIPA consumption performs better relative to using the provided NIPA consumption. |
Another line of argument suggests that the relevant consumption risk is measured at the wrong frequency, thereby suggesting a more “long-horizon” measure:
| Paper | Punchline |
|---|---|
| Parker and Julliard (2005) ”Consumption Risk and the Cross Section of Expected Returns” | Measuring risk of a portfolio by its return covariance with consumption growth over multiple quarters performs better than using contemporaneous covariance. |
| Malloy, Moskowitz, and Vissing-Jorgensen (2005) ”Long-Run Stockholder Consumption Risk and Asset Returns” | Measuring risk faced by the wealthiest of stock holders performs better relative to the traditional measure. |
| Jagannathan and Wang (2007) ”Lazy Investors, Discretionary Consumption, and the Cross-Section of Stock Returns” | Replacing annual consumption growth with fourth quarter to fourth quarter consumption growth performs better. |
A tricky part about “measuring” consumption is that it naturally begets auxiliary debates such as the right specification of the consumption process, the form of the utility function, and the marginal investor. This paper seems to be one attempt that directly addresses this difficulty.
Nota Bene
I conclude by listing other examples that operate in the same vein:
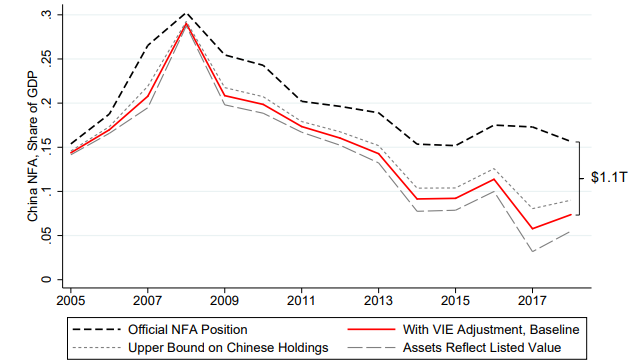
- Coppola, Maggiori, Neiman, and Schreger (2021), “Redrawing the Map of Global Capital Flows: The Role of Cross-Border Financing and Tax Havens”
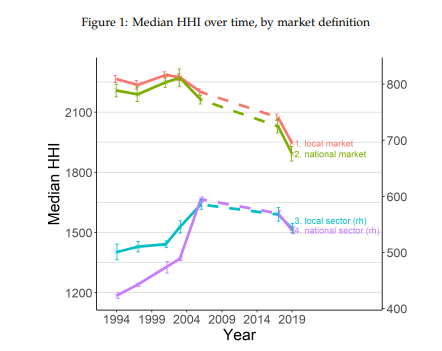
- Benkard, Yurukoglu, and Zhang (2021), “Concentration in Product Markets”
- Kwon, Ma, and Zimmermann, “100 Years of Rising Corporate Concentration”