Selection Bias in Finance
In this post, I summarize some famous examples of selection bias in finance and economics. Hopefully they serve as a useful reminder that even when identification and estimation are sound, there are always lingering concerns about external validity.
Overview
In general, the data we use are obtained from a third-party provider who collect data based on their own criteria. This means that there are generally two types of selection biases that one may worry about:
- Criteria-based Selection: This is when a subset of the data is systematically excluded due to some criteria, either imposed by the data provider or the accompanying regulation.
- For example, the SEC’s form 13F has an AUM cutoff: it is required to be filed by all institutional investment managers with at least $100 million in AUM.
- Survivorship-based Selection: This happens when the sample drops out naturally because the entity no longer survives. For example, if a firm delists it is no longer included in Compustat.
Example 1. Compustat
Compustat, perhaps one of the most widely used source for accounting and financial data, primarily covers public companies. This is an important consideration when one studies topics that may impact private and public firms differentially such as the role of financing constraints or investment behavior.
To see the sampling bias of Compustat most bluntly, consider this table from Crouzet and Mehrotra (2020) who juxtapose the Quarterly Financial Report (QFR) data with Compustat:
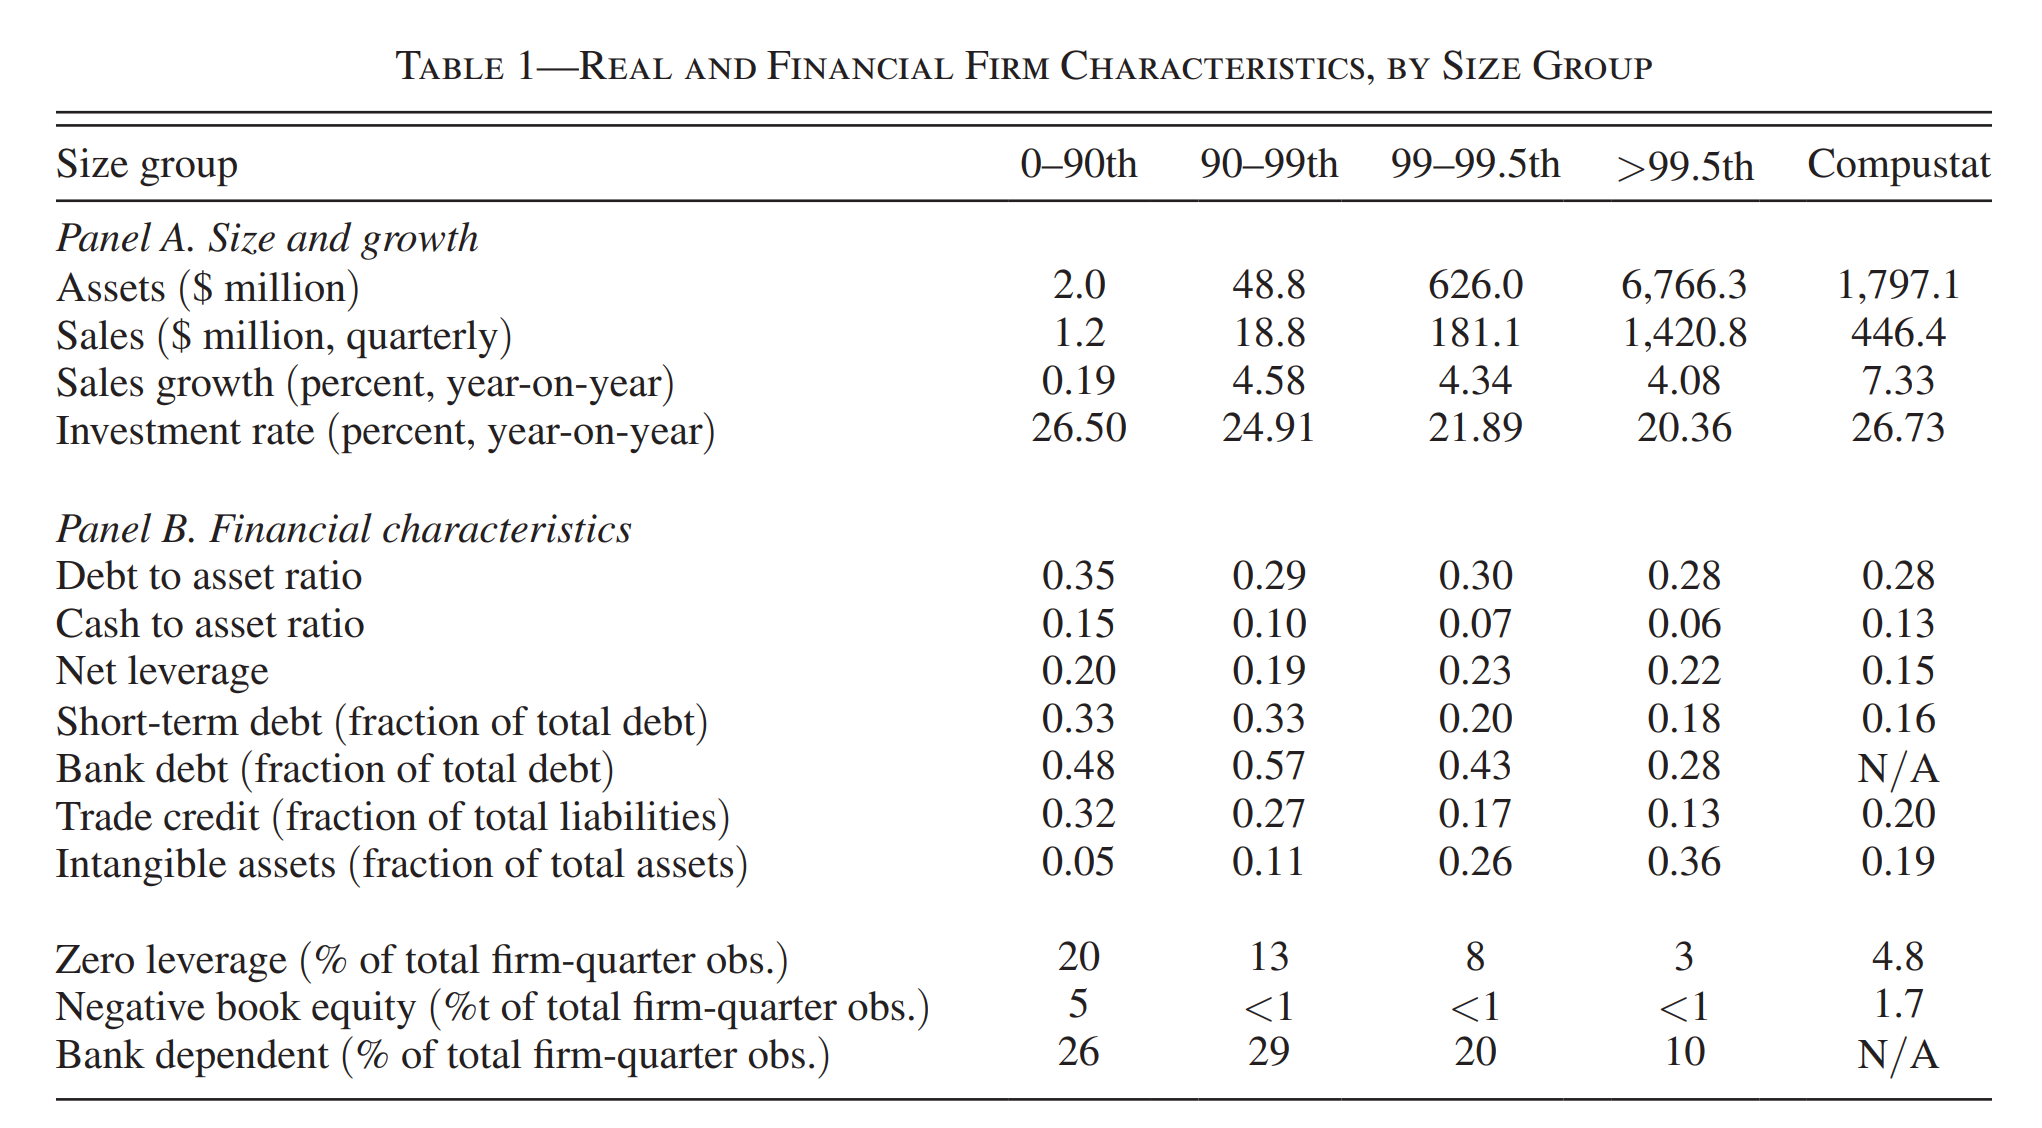
The last column reports the average value for the Compustat manufacturing segment, while the first four columns report the distribution of equivalent statistics for the QFR sample. The Compustat average is close to the average size of the top 1% of the QFR sample!
So how much does this affect results? Take a look at this fascinating figure from Zwick and Mahon (2017) who estimate the effect of temporary tax incentives on investment:
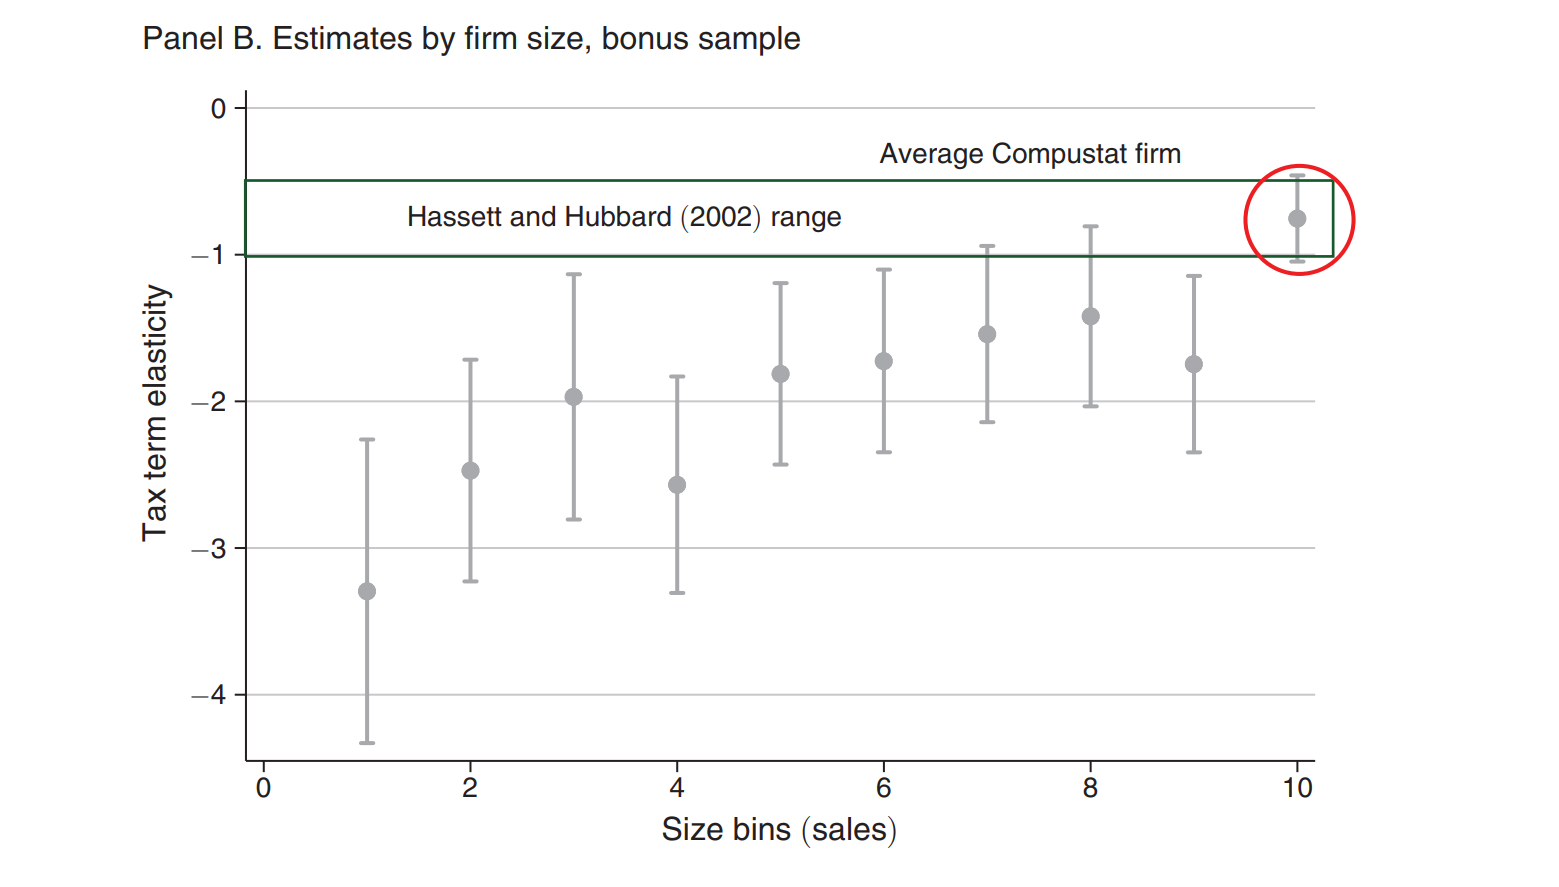
Since their sample is drawn from corporate tax returns, more than half the firms in their sample are smaller than the smallest firms in Compustat. As a result, the largest firms in the sample yield estimates in line with past studies of other tax reforms (the red circle in the figure), while small and medium-sized firms show much stronger responses.
Example 2. Convergence Analysis
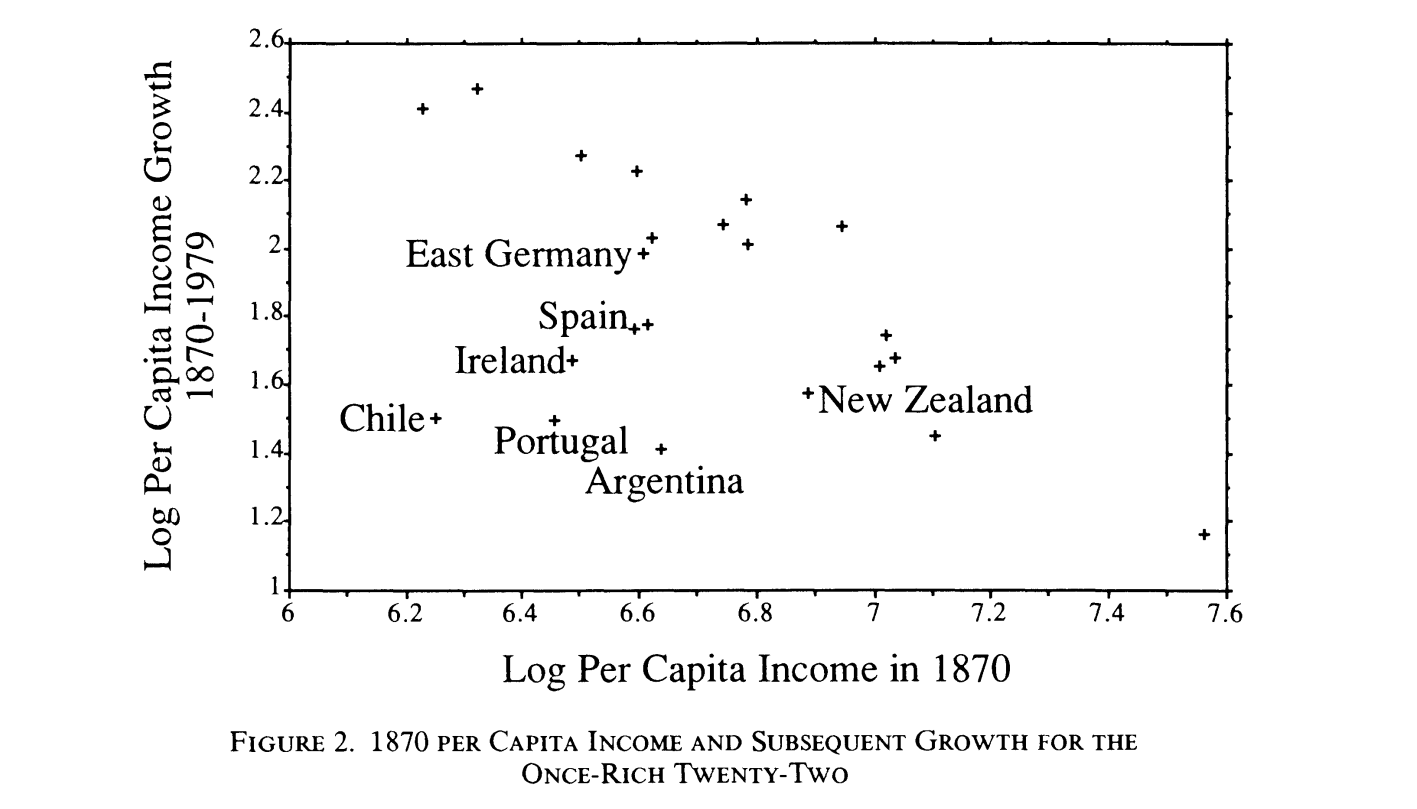
Another famous selection bias comes from international comparison of countries. Baumol (1986) argued that convergence in national productivity levels is seen in the growth of industrial nations since 1870, which is obtained from a regression of income growth since 1870 on the income in 1870:
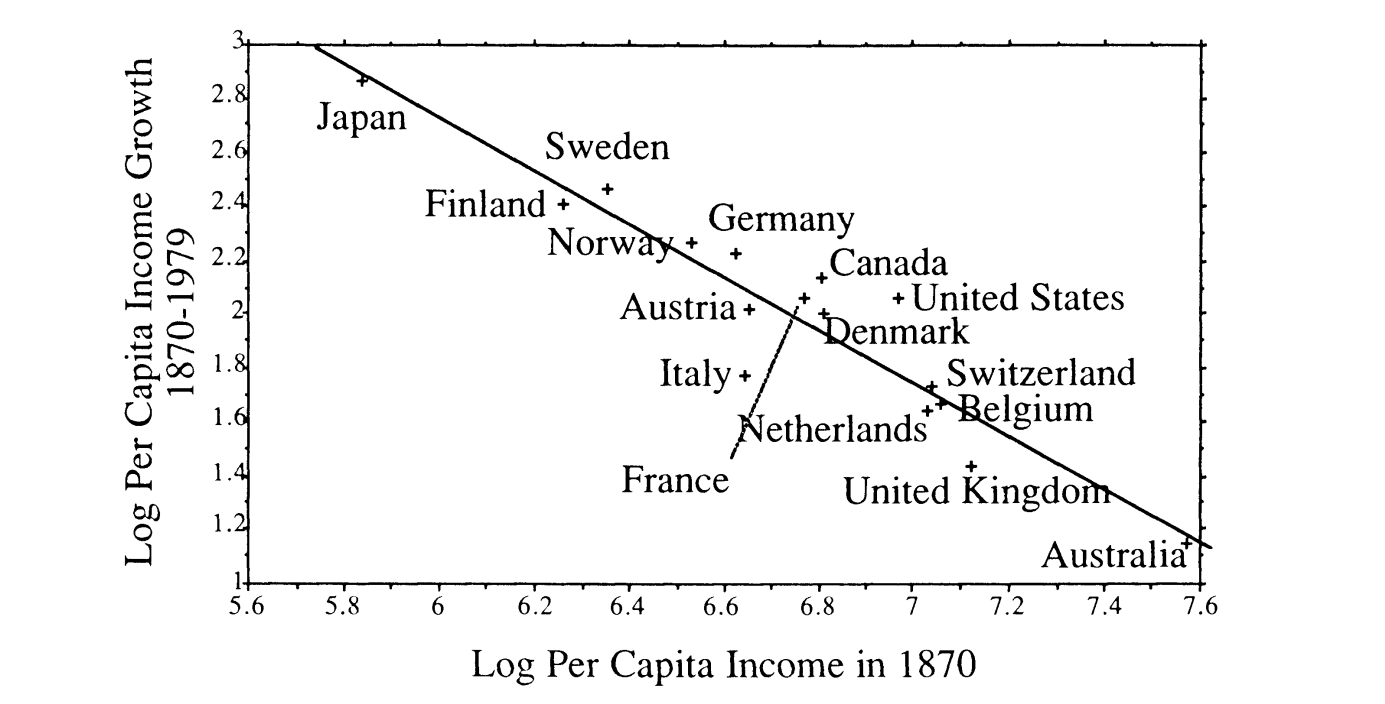
De Long (1987), however, later pointed out that the results are primarily driven by selecting a sample of countries that had easily available data. Naturally, these countries will seem to converge to each other. Instead, De Long constructs an unbiased sample made up of nations that had high potential for economic growth as of 1870.
For example, as you add “once-rich twenty-two” sample — which is a set of countries that includes nations who had good potential in 1870 but did not live up to the hype — you obtain the following graph:
Fortunately, now that the IMF / BIS offer a comprehensive coverage of countries, this particular selection issue seems less perilous than before.
Example 3. Backtesting with CRSP
The impact of survivorship bias is most pronounced when it comes to backtesting investment strategies. One particular peril is that of delisted firms. For example, consider the following proportions of delisted vs. active firms taken from this website:
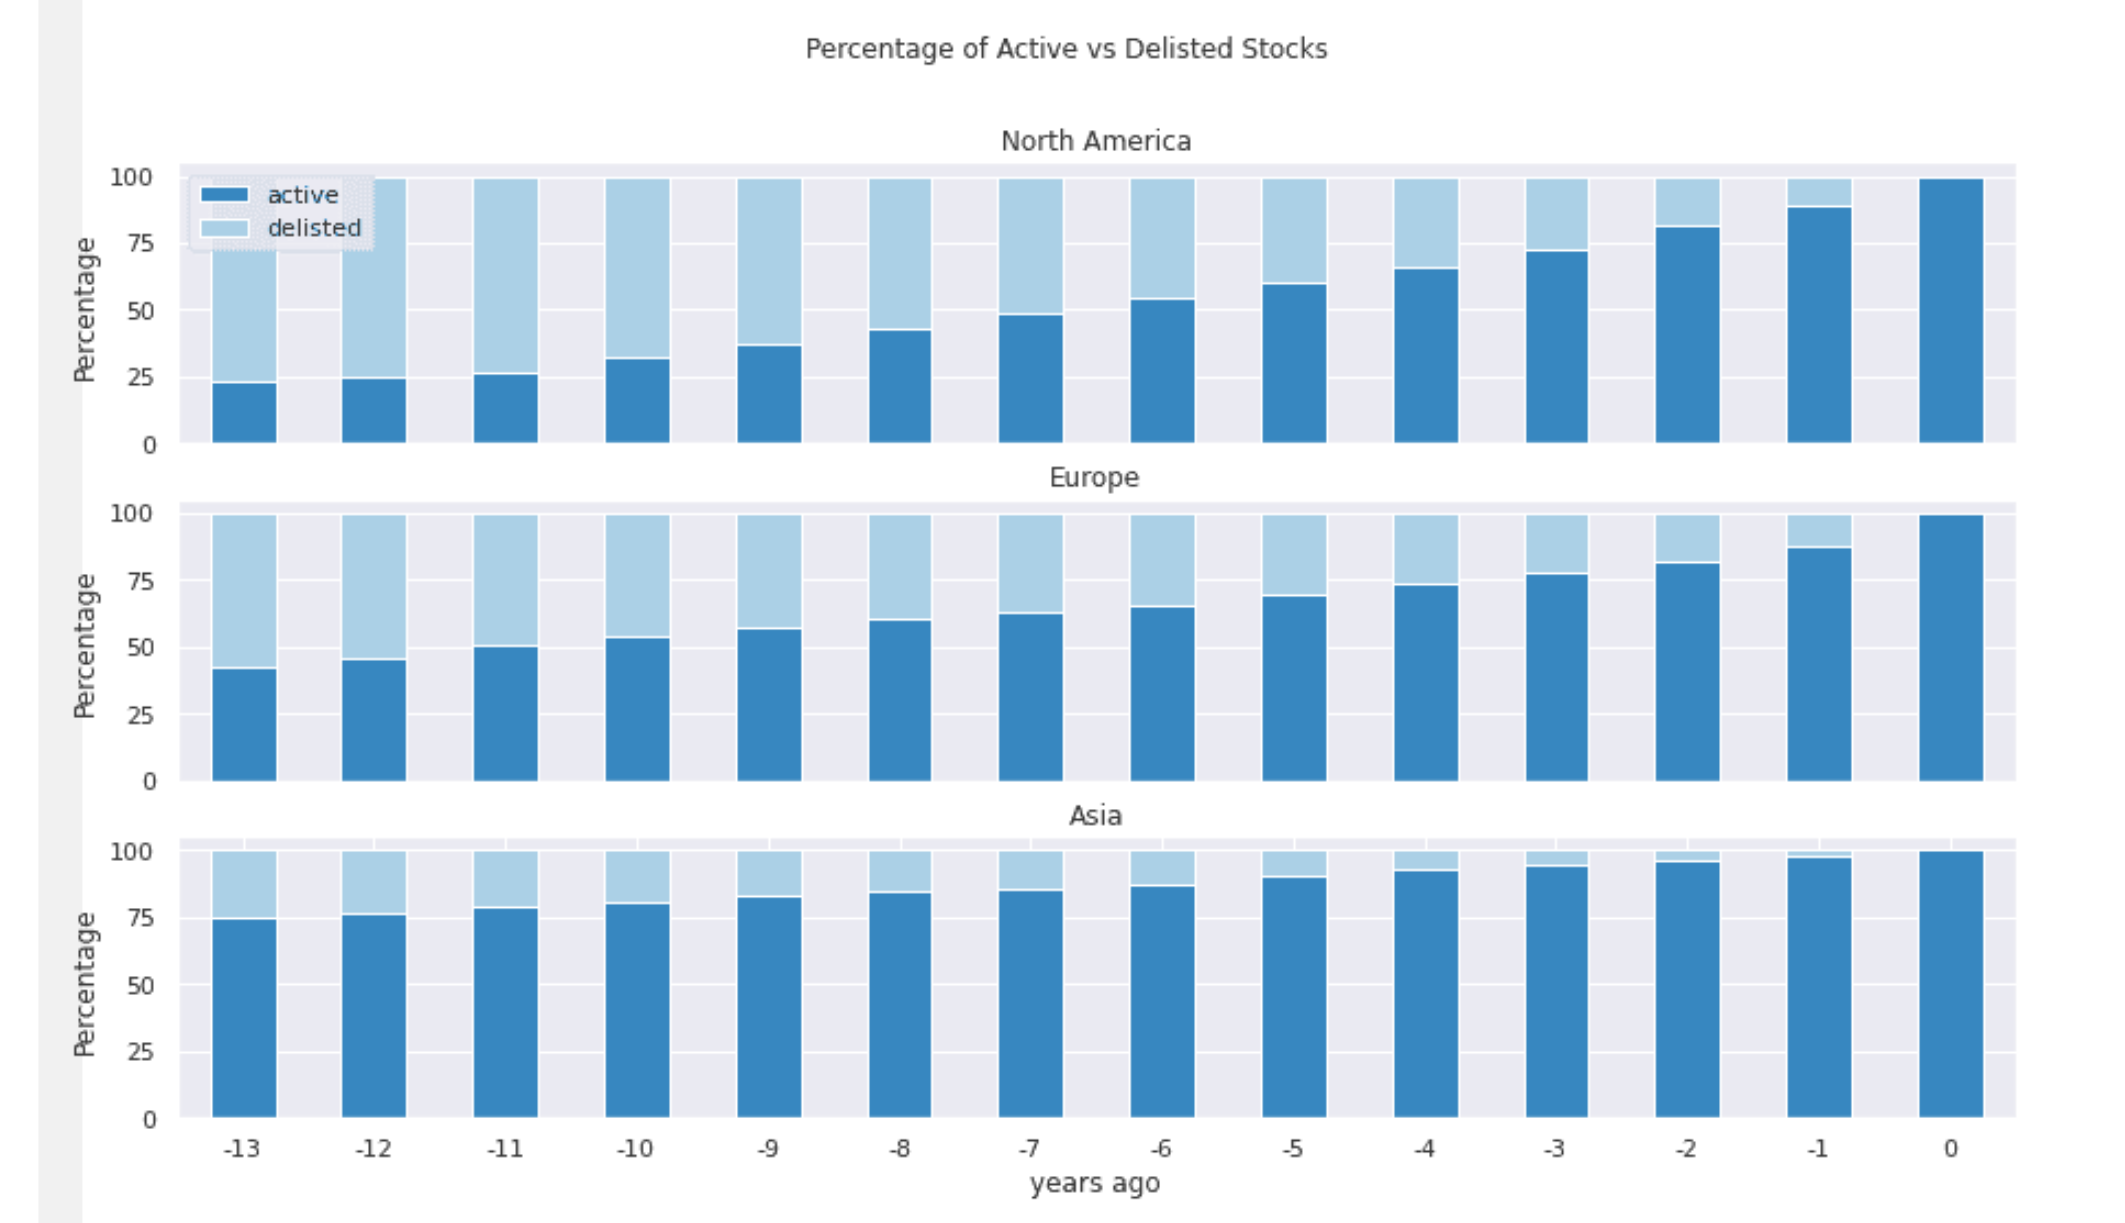
For academic analyses, survivorship bias would be a concern if the survivorship were not random. And for finance, this is definitely not the case.
A firm may delist (and therefore disappear from the database) because it goes bankrupt, decides to go private, or gets acquired by another firm. All three decisions are endogenous choices by firms, which depend on business cycles, market sentiment, or financing conditions. Not surprisingly, these are the factors that also affect portfolio returns, firm investments, and fund behaviors.
Example 4. Hedge Fund Data
Given that hedge funds are not exactly known for their transparency, the data on hedge funds is also prone to selection bias. It is particularly more severe for hedge funds since many of them report voluntarily to commercial databases.
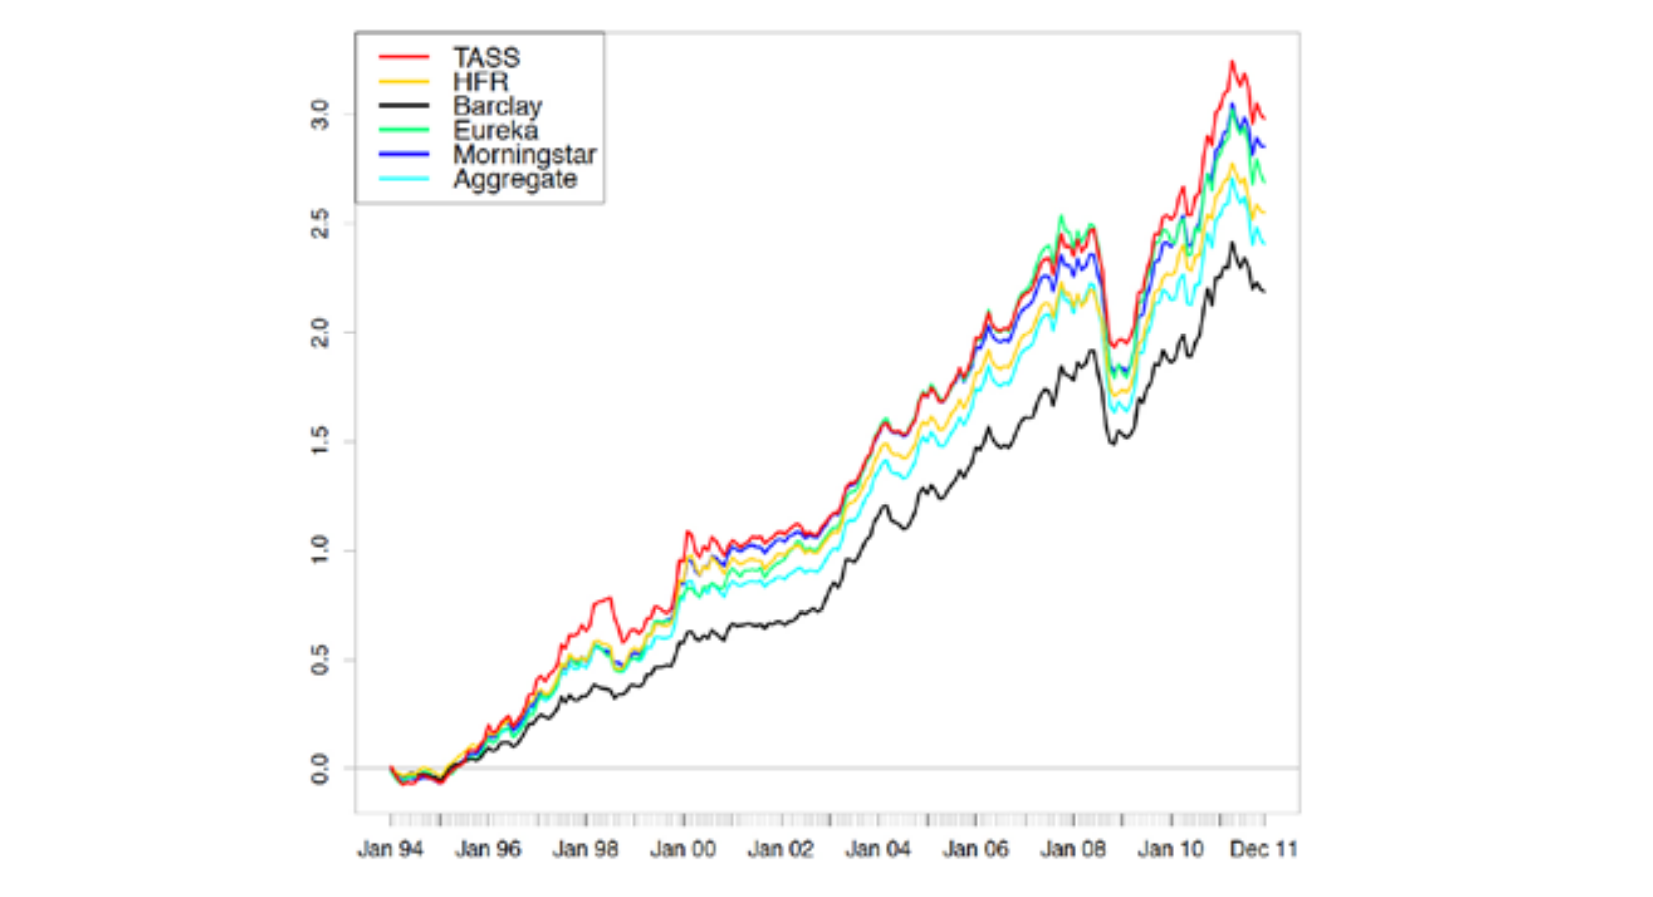
Consider this fascinating graph from Joenväärä, Kauppila, Kosowski, and Tolonen (2019)’s paper, “Hedge Fund Performance: Are Stylized Facts Sensitive to Which Database One Uses?” (Their paper also has a great history of how the evolution of these databases):
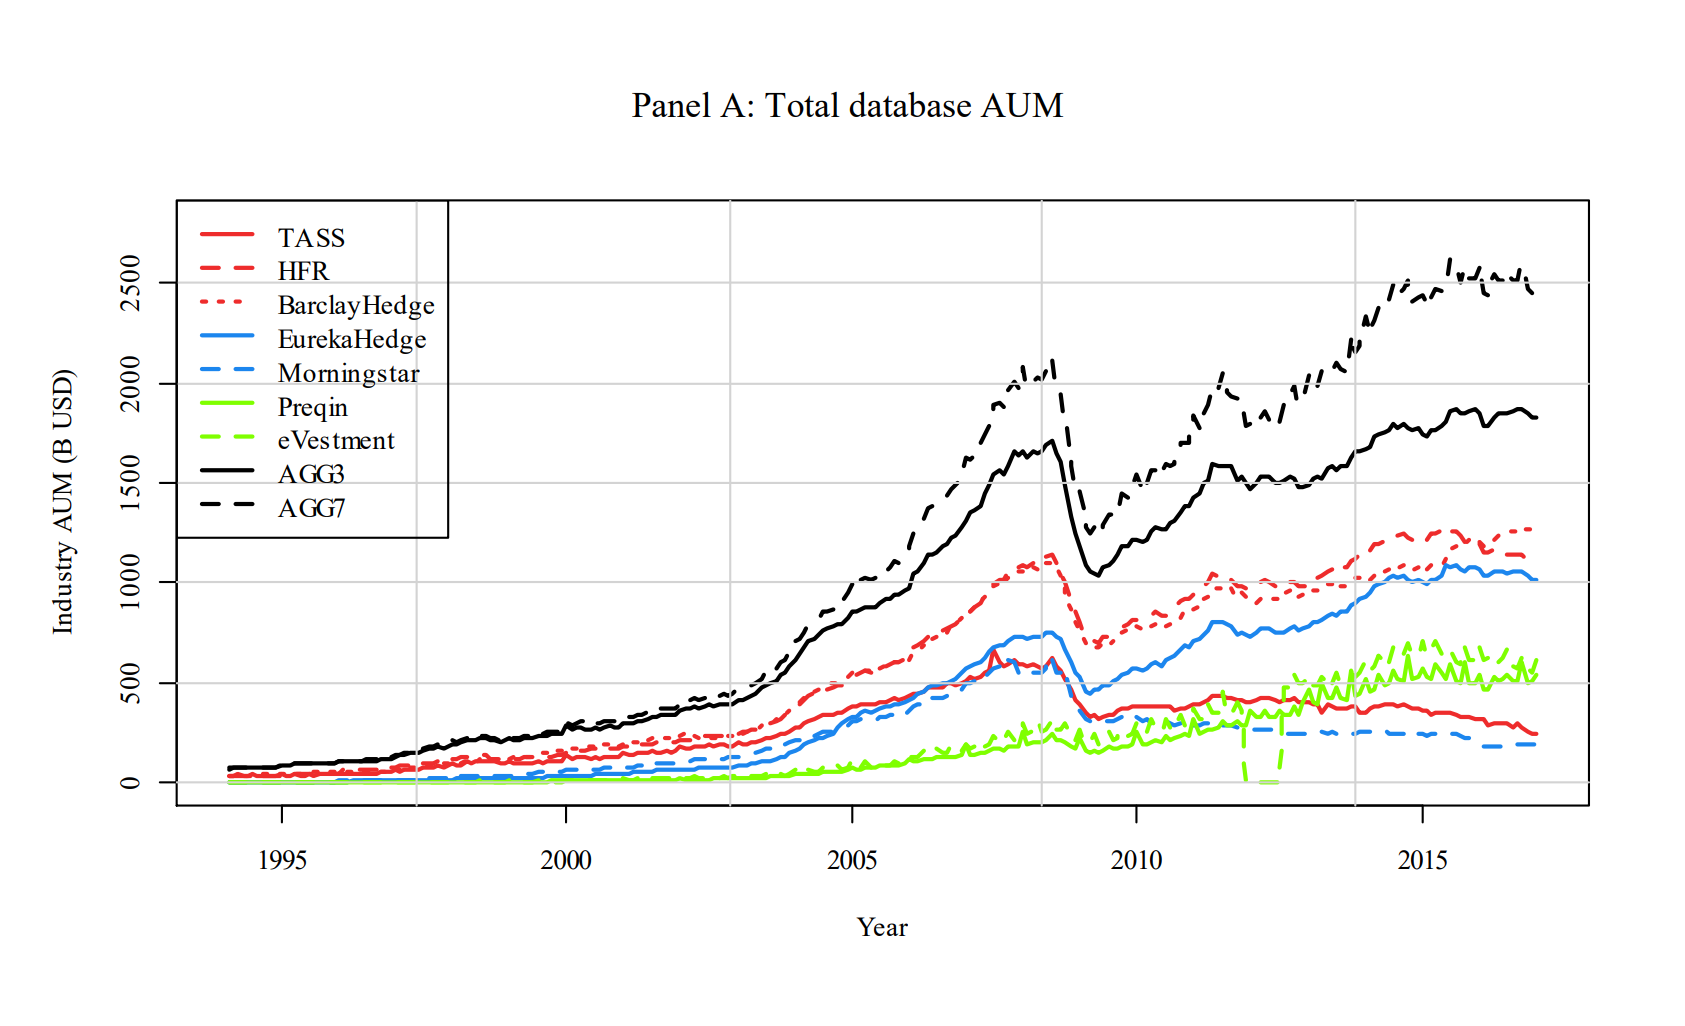
The substantial differences in AUM also translate into disparities in performance (taken from an older version of their paper), as can be seen in the figure below which plots the value-weighted excess returns across the different databases.