Skewness Strikes Back
Skewness in the distribution of economic outcomes is underappreciated. In this post, I summarize some basic insights regarding skewness in three themes. I also describe why I think now is a particularly interesting time to focus on skewness.
Prelude
Skewness generally refers to an asymmetry in a statistical distribution. A conventional measure of skewness is the standardized third moment:

where \(\mu\) and \(\sigma\) are the mean and the standard deviation of random variable \(X\).
- Obviously, this measure can be sensitive to outliers at the extreme tails of the distribution, which makes measurement quite challenging. As a result, alternatives like the Kelly’s Measure has been proposed and used quite frequently.
There are broadly two ways to measure skewness. First is to obtain past values of the economic variable of interest and use sample moments of the above formula. The alternative is to use option prices. As is well-known, however, option prices deliver risk-neutral skewness, not the physical skewness. A recent paper addresses the limitations of both approaches and instead proposes using the cross-section to isolate the desired quantity of interest, which has been popular in the term structure literature. Furthermore, studies have suggested using information from volatility and trading volume to fine-tune the measurement.
#1: Do investors care about skewness?
The discussion on skewness has been most active within asset pricing. In contemplating the role of skewness for equity risk premia, researchers have usually extended what they have learned about variance.
One intuitive argument is as follows.
- Holding mean and variance held constant, investors prefer positively skewed to negatively skewed portfolios. In such case, stocks with negative skewness — a larger chance of a large loss — should be associated with higher expected returns.
- Furthermore, CAPM tells us that only the stock’s contribution to the total variance of a well-diversified portfolio should be priced. Extending this logic to skewness implies that only the stock’s contribution to the portfolio’s skewness should be priced.
This argument is indeed supported by Kraus and Litzenberger (1976) and Harvey and Siddique (2000) who find that coskewness has a significant impact on equity risk-premia. These two papers have been extended by papers that focuse on the role of systematic skewness (e.g. Simaan (1993), Dittmar (2002), Chabi-Yo, Leisen, and Renault (2014)).
However, we also know that idiosyncratic volatility seems to matter in addition to systemic risk, so it’s also reasonable to examine a similar role of idiosyncratic skewness.
Indeed, theories have come up with various mechanisms to have idiosyncratic skewness matter — heterogeneous preferences (Mitton and Vorkink (2007)), prospect theory preferences (Barberis and Huang (2007)), and distorted beliefs (Brunnermeier and Parker (2005)). Empirically, it does seem to explain a lot of variation in expected returns as well.
#2: What mechanisms lead to skewness?
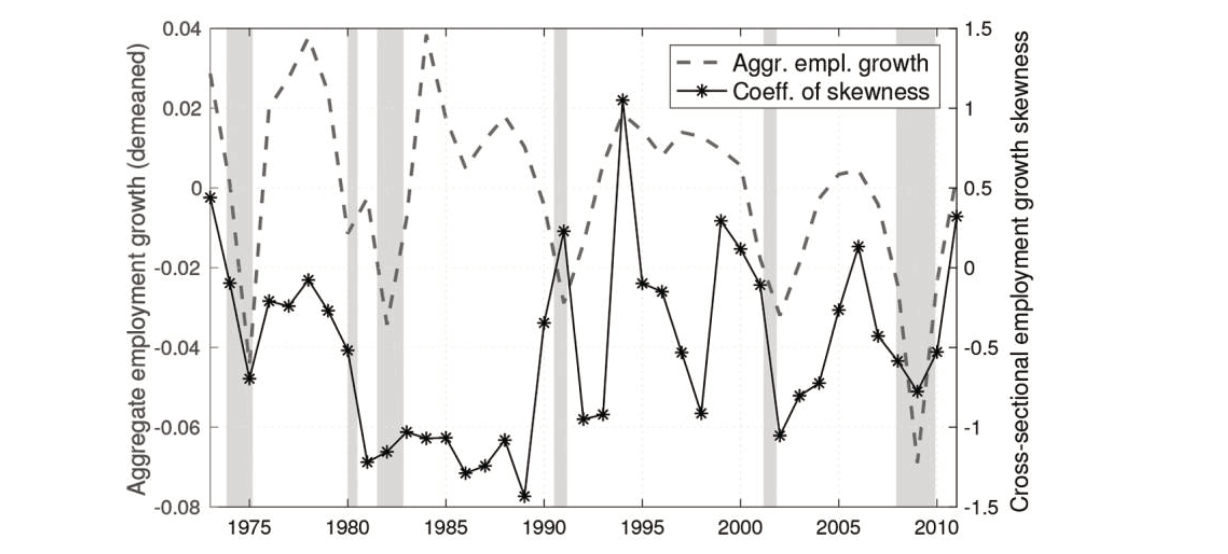
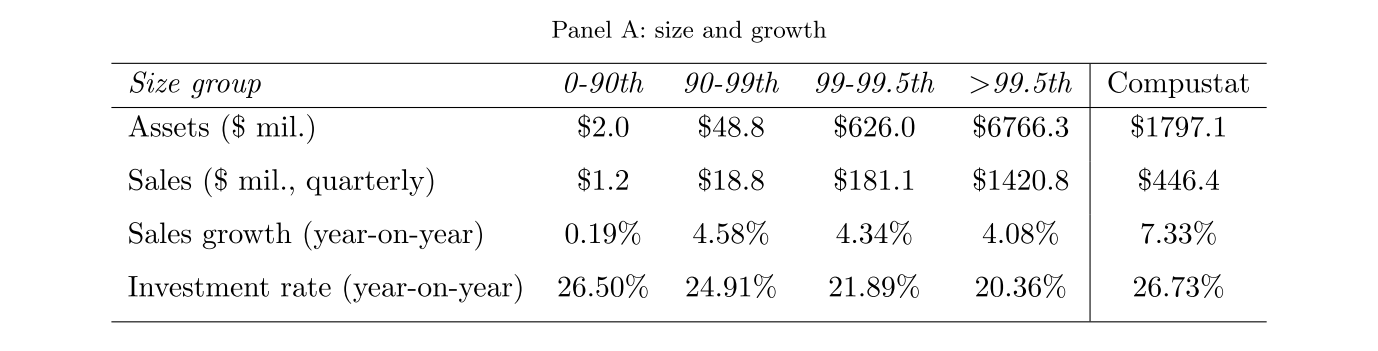
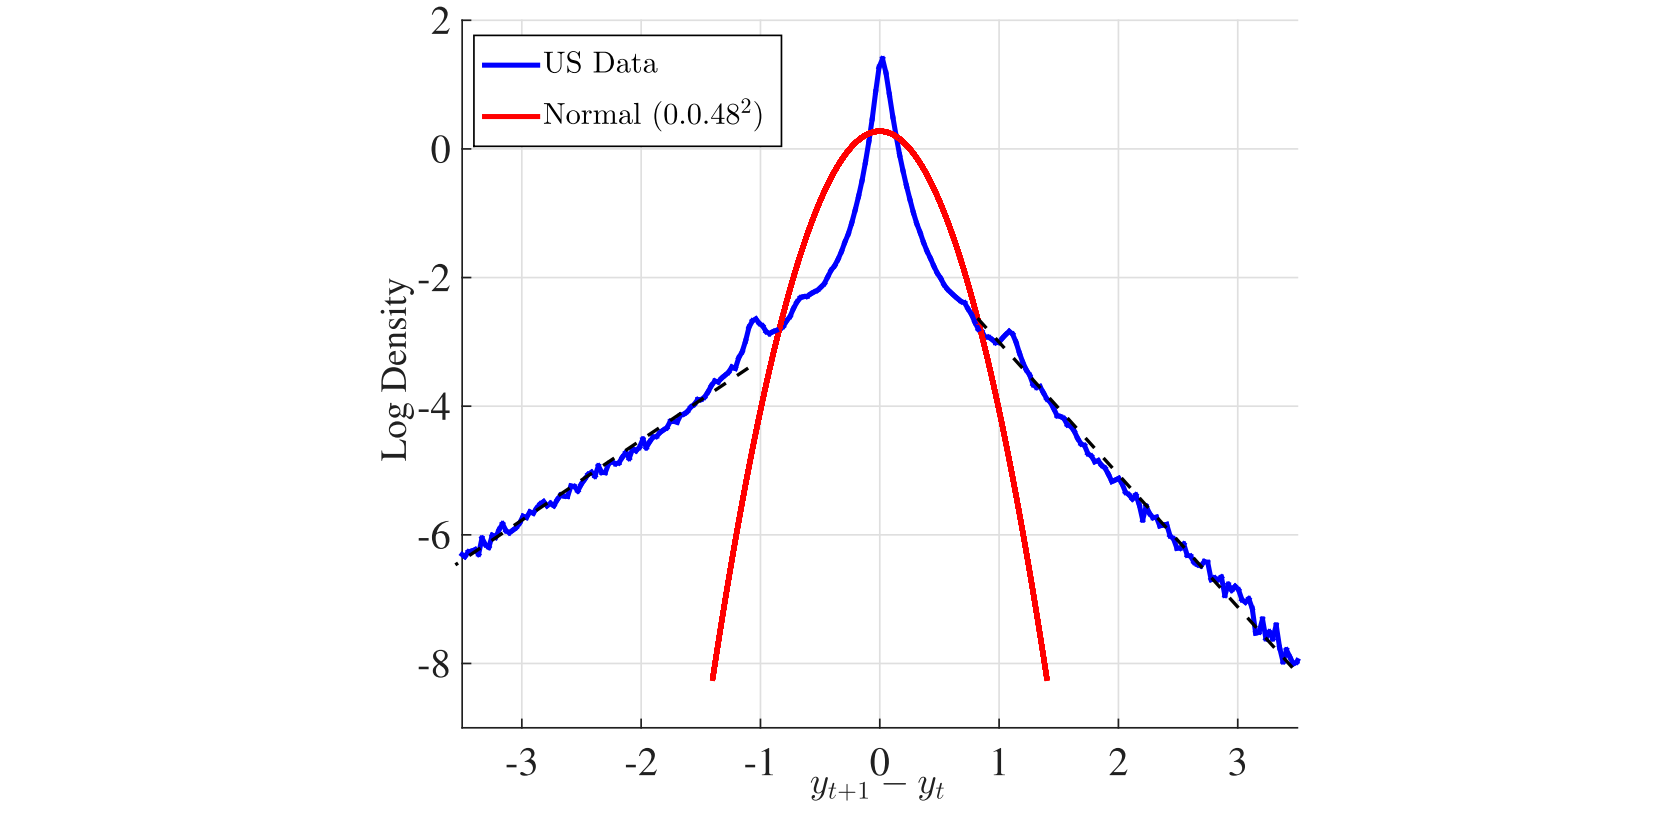
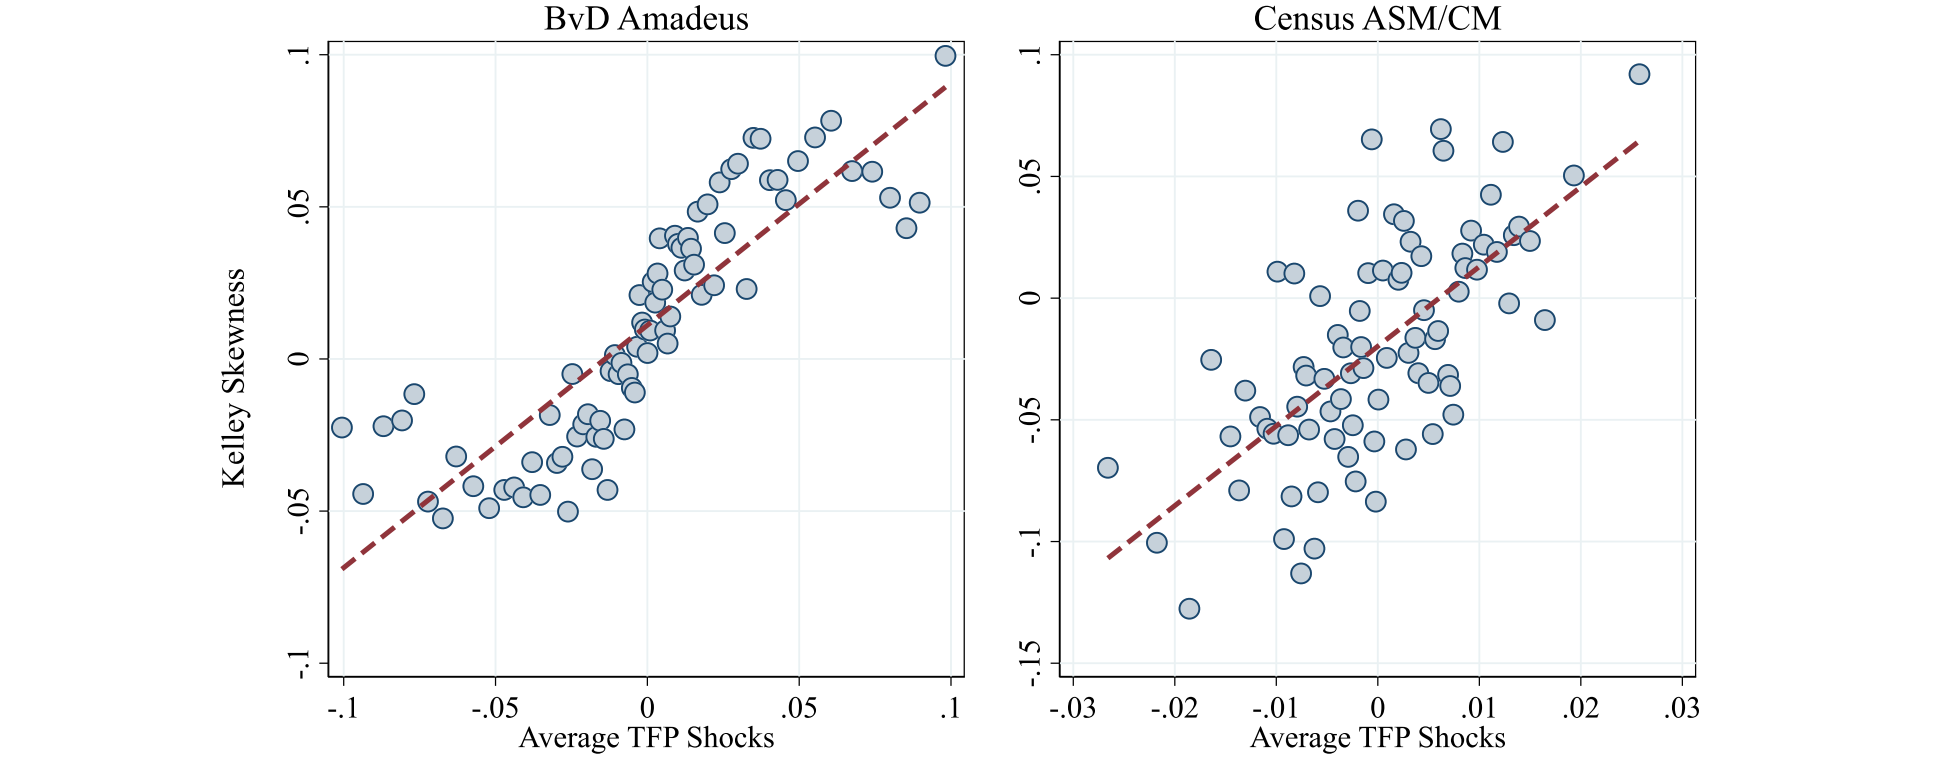
There has also been a growing appreciation of skewness in macroeconomics, mostly in the cross-section. Recent research find skewness in a wide set of variables:
- Employment growth: Ilut et al. (2018)
- Sales and investment: Crouzet and Mehrotra (2020)
- Labor earnings: Guvenen et al. (2015)
- Productivity: Salgado et al. (2019)
- Wealth: Gomez and Gouin-Bonenfant (2020))

- Stock Returns: Oh and Wachter (2021)
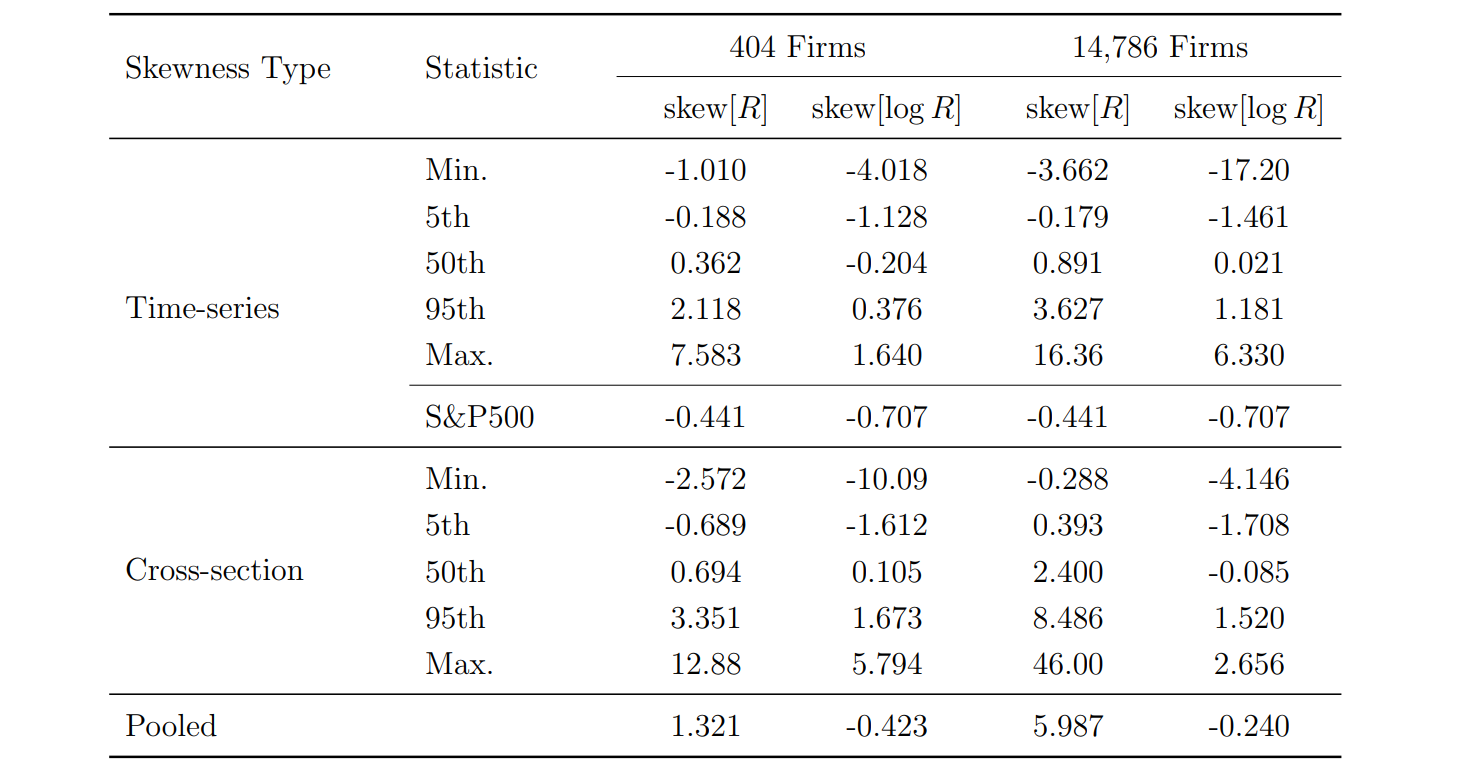
The level of skewness observed in the data helps us discipline our models, whether they be of asset prices, labor dynamics, and business cycles. In particular, as I describe later, distinguishing the role of aggregate shocks from their idiosyncratic counterparts seems to be key.
#3: What are the consequences of skewness?
A more recent body of work focuses on the implications of skewness. The common thread among these papers, first emphasized in Gabaix (2011) and Acemoglu et al. (2012), is the observation that skewness in the cross-section naturally leads to a lack of diversification, and thus *idiosyncratic *shocks are an important source of *aggregate *fluctuations.
Subsequent work has empirically verified this in the data. I list some examples below:
- Galaasen et al. (2021) focus on the lack of diversification in the loan portfolios of Norwegian banks. As a result, the losses of a single firm can significantly impact the profitability of a bank, which then spills over to other borrowers.
- Ben-David et al. (2021) note that large institutional investors own an outsized share of equity markets in the U.S. As a result, ownership by large institutions is associated with higher volatility in stock prices.
- Gaubert and Itskhoki (2021) start with the observation that a large share of exports is done by a small number of large firms, which thereby shape the country’s trade patterns (think Samsung for Korea). They then contemplate the role of these individual firms in determining the comparative advantage of countries.
Coda: Why Skewness?
Here are three reasons why I think it is particularly exciting to study skewness today.
First, studies have shown that retail investor portfolios have higher skewness than those of institutional investors. (e.g. Kumar (2009)). The recent saga with meme stocks is probably the best example of retail investors seeking skewness:
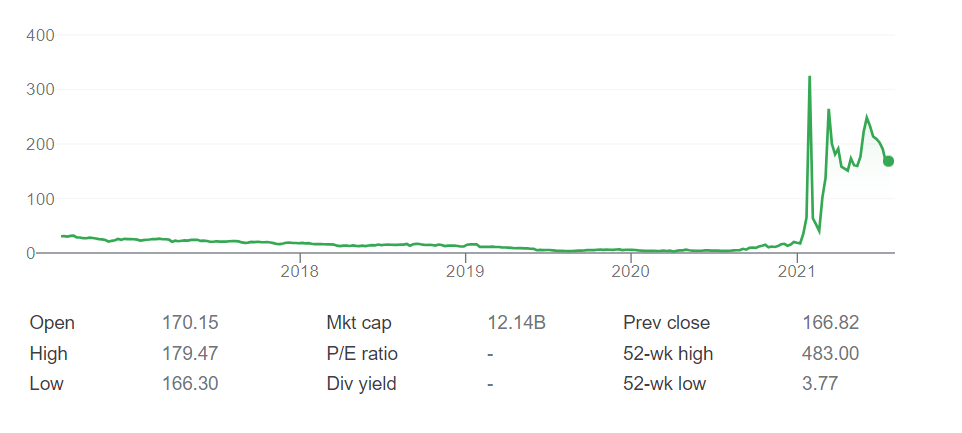
The introduction of Robinhood and other retail investing platforms can be thought as increasing the share of investors who seek positive skewness. Accounting for this preference seems to be a first-order consideration for deriving the asset pricing implications of increased retail participation.
Second, discussions about inequality are ultimately about skewness in the cross-section. Given the key policy aim of alleviating inequality, it is critical to understand what drives it in the first place. To this end, Benhabib and Bisin (2018) provide a nice overview of related discussion for wealth inequality.
Finally, a recent paper by Ralph Koijen and Xavier Gabaix suggest a way to leverage the skewness in the cross-section to isolate idiosyncratic shocks and use them to estimate causal parameters in economics. Their Granular Instrumental Variable (GIV) has already been applied in a multitude of papers and seems promising for achieving identification in a granular setting.